Building a Power Monitoring System with ESP32 and PZEM-004T: A Pull-Based MQTT Home Assistant Implementation
Frustrated with unreliable smart plugs, I built a power monitoring system using an ESP32 and PZEM-004T v3. It measures voltage, current, power, and energy, storing data in InfluxDB with a React frontend, with plans for Home Assistant.

Preface
I’ve been very conscious about how much power my homelab uses, so I started exploring power monitoring solutions with a few key requirements:
- Measure energy consumption accurately.
- Record data for historical analysis.
- Integrate with MQTT for compatibility with Home Assistant.
- Be easy to operate with a user-friendly interface.
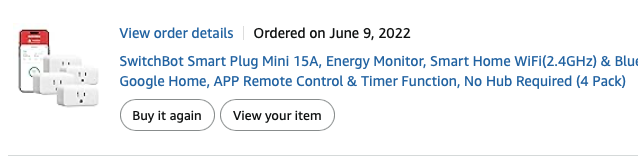
My first attempt was with SwitchBot smart plugs. They offered decent power monitoring with detailed graphs and stable cloud integration with Home Assistant. However, their build quality was poor—two out of a four-pack failed to connect reliably to WiFi, despite the switch functionality still working.
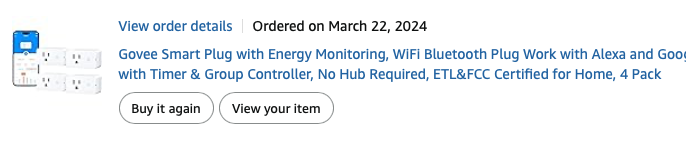
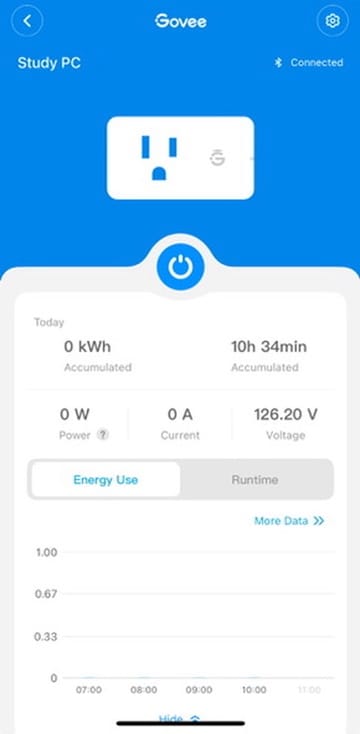
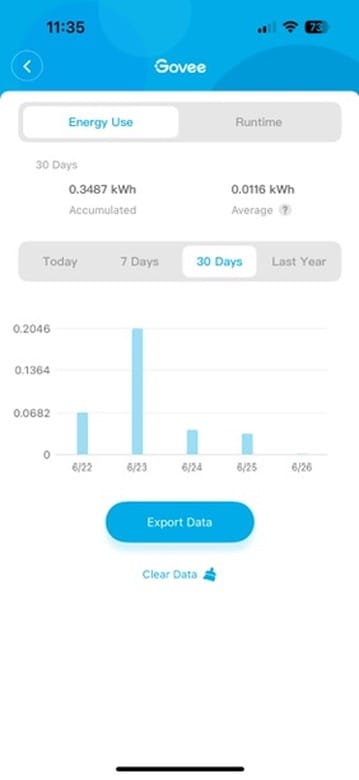
Next, I tried the Govee Power Monitoring Plug. Its functionality was limited, providing only instantaneous data and oddly aggregated graphs. The timed measurement capped at 100 seconds, which was impractical, and it lacked Home Assistant integration.
Frustrated with off-the-shelf options, I decided to build my own solution. This tutorial walks you through creating a power monitoring system using an ESP32 (ESP-WROOM-32) and a PZEM-004T v3 sensor. It measures voltage, current, power, and energy, stores data in InfluxDB, and uses Grafana for visualization, with future MQTT integration in mind. A simple yet functional frontend provides an intuitive interface. While I plan to add MQTT for Home Assistant integration later, this setup already outperforms commercial plugs.
Project Overview
DISCLAIMER
Hardware:
Here are the components you’ll need (links include Amazon Affiliate codes to support this blog):
- ESP-WROOM-32
- Breadboard for testing and developing
- PZEM-004T v3 sensor, powered at 3.3V from ESP32 board.
- Jumper wires and other small components
- Extension cord
Here are a few tools and parts:
Software:
All code is available in my GitHub repository under the GNU General Public License v3.0.
- ESP32: Arduino sketch with an HTTP server to serve PZEM data on request.
- Backend: InfluxDB for data storage, with Telegraf as the data collection agent.
- Frontend: React-based web interface to display data and control the system.
- Grafana: Dashboard for visualizing trends and real-time metrics.
Key Features:
- Real-time monitoring of voltage, current, power, and energy.
- Pull-based data collection via HTTP.
- Data recording and export in JSON format.
- User-friendly React dashboard.
- Grafana visualizations for historical analysis.
Hardware Setup
Pinout
Correct wiring is critical. I initially struggled with the PZEM address flipping between 0x00 and 0x07, which I fixed by powering the PZEM at 3.3V and adding capacitors. A key breakthrough was using the correct serial pins (Serial2: TX2 and RX2) on the ESP32.
| PZEM-004T Pin | ESP32 Pin | Description |
|---|---|---|
| VCC | 3.3V | Powers PZEM at 3.3V to prevent address flipping. |
| GND | GND | Common ground, adjacent to 3.3V pin. |
| RX | GPIO 16 (TX2) | PZEM RX connects to ESP32 TX2 (Serial2). |
| TX | GPIO 17 (RX2) | PZEM TX connects to ESP32 RX2 (Serial2). |
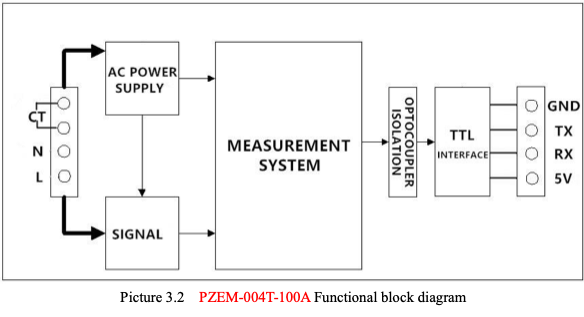
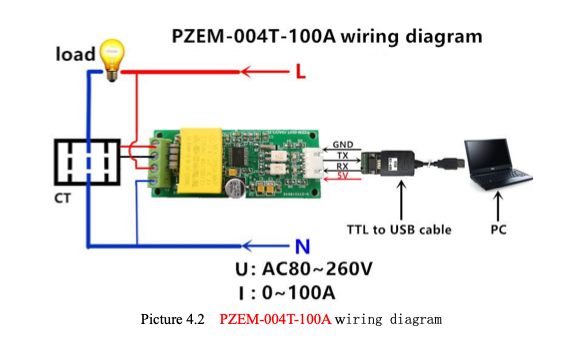
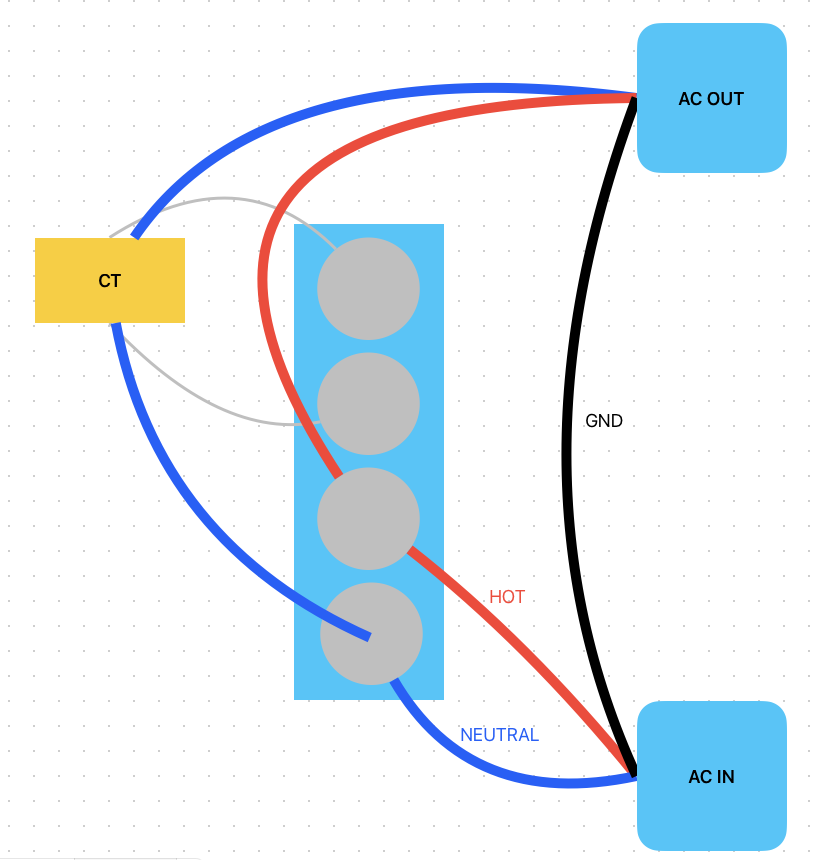
For the AC side of the PZEM-004T-100A, I cut an extension cord in half, passed the neutral wire through the current transformer (CT), and wired the hot and neutral per Peacefair’s diagram. The ground was reconnected for safety. Note: The PZEM-004T-100A uses a CT, unlike the 10A version, which has a different wiring setup.
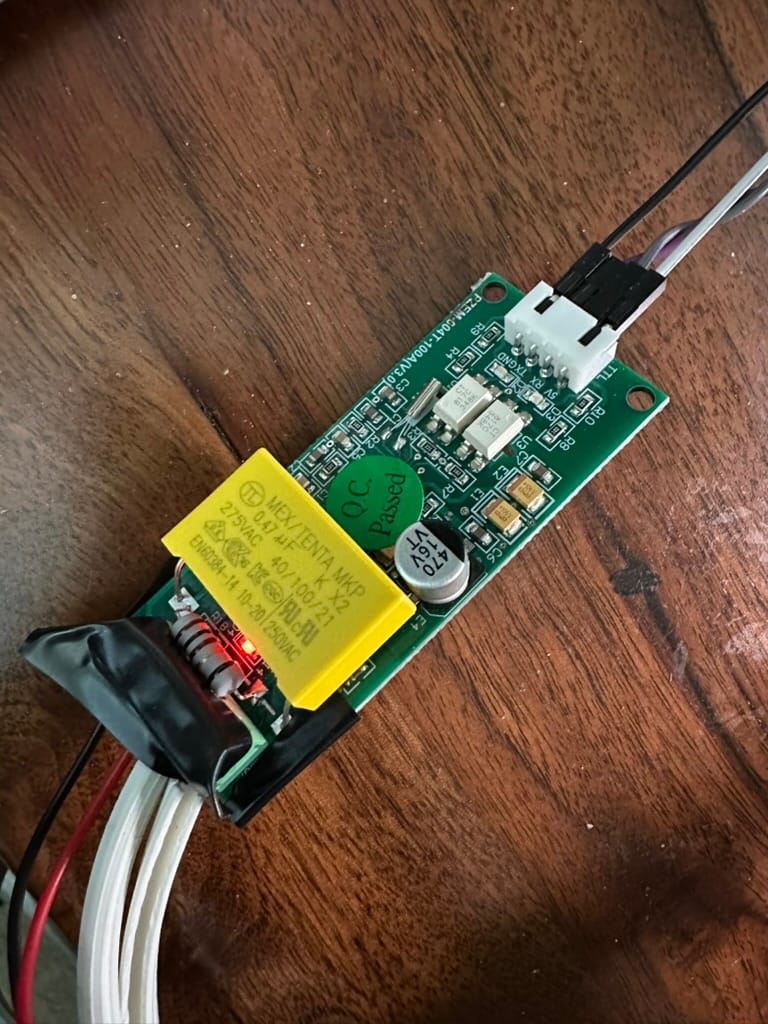
I wrapped exposed high-voltage parts with electrical tape for safety. Here’s the final setup:
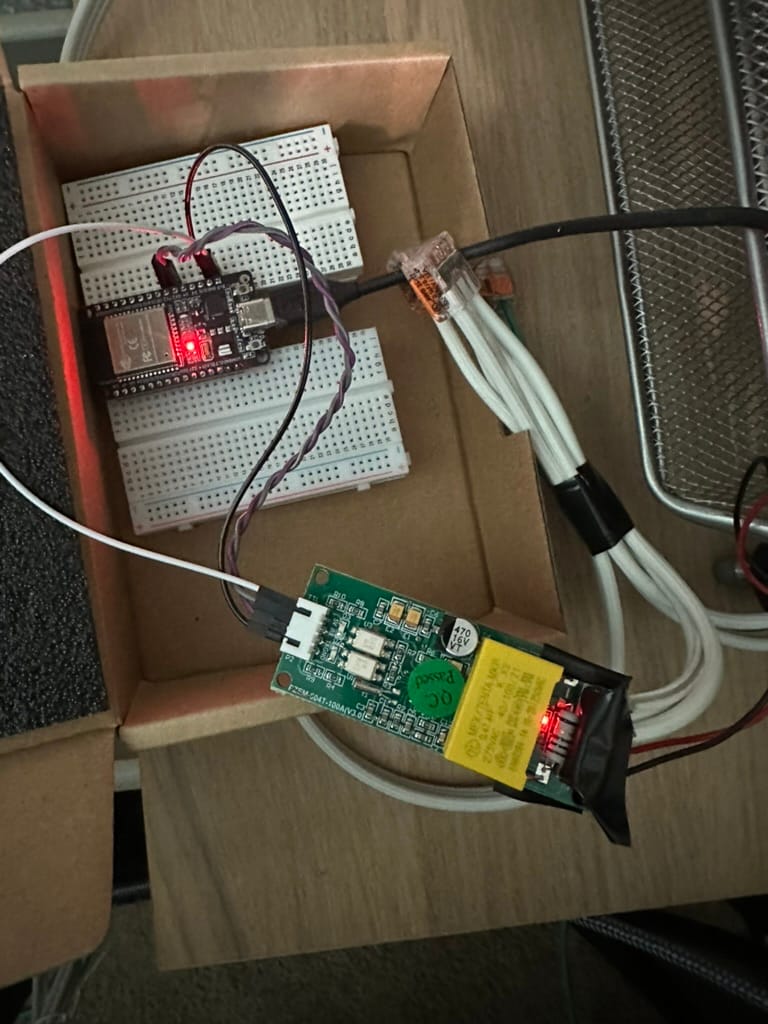
Additional Setup
Power notes:
Although the manual requires 5V, I have better luck with 3.3V straight from the ESP32. Use a multimeter to confirm ~3.3V stability. Loose breadboard connections can cause issues, so secure all wires. Place a 100µF (electrolytic, positive to VCC) and 0.1µF (ceramic) capacitor across VCC and GND near the PZEM to filter noise.
Gotcha:
Using incorrect serial pins (e.g., GPIO 1/3 for Serial0) caused communication failures. Always use GPIO 16 (TX2) and GPIO 17 (RX2) for Serial2.
Software
All code is in my Github repo, licensed under GPL-3.0.
ESP32 with Frontend
The code is in the Github repo under the folder “esp32/energy_monitor”. There is a configuration file that you can modify to suit your needs:
- WiFi credentials
- Timezone
- MQTT Integration
ESP32 only supports 2.4GHz WiFi so if you have a dual band AP/Router, it might be better if you carve out an SSID with just 2.4GHz radio.
Use the Arduino IDE to edit and upload the sketch. Once uploaded, access the frontend at the ESP32’s IP address (e.g., http://192.168.1.x). The dashboard looks like this.
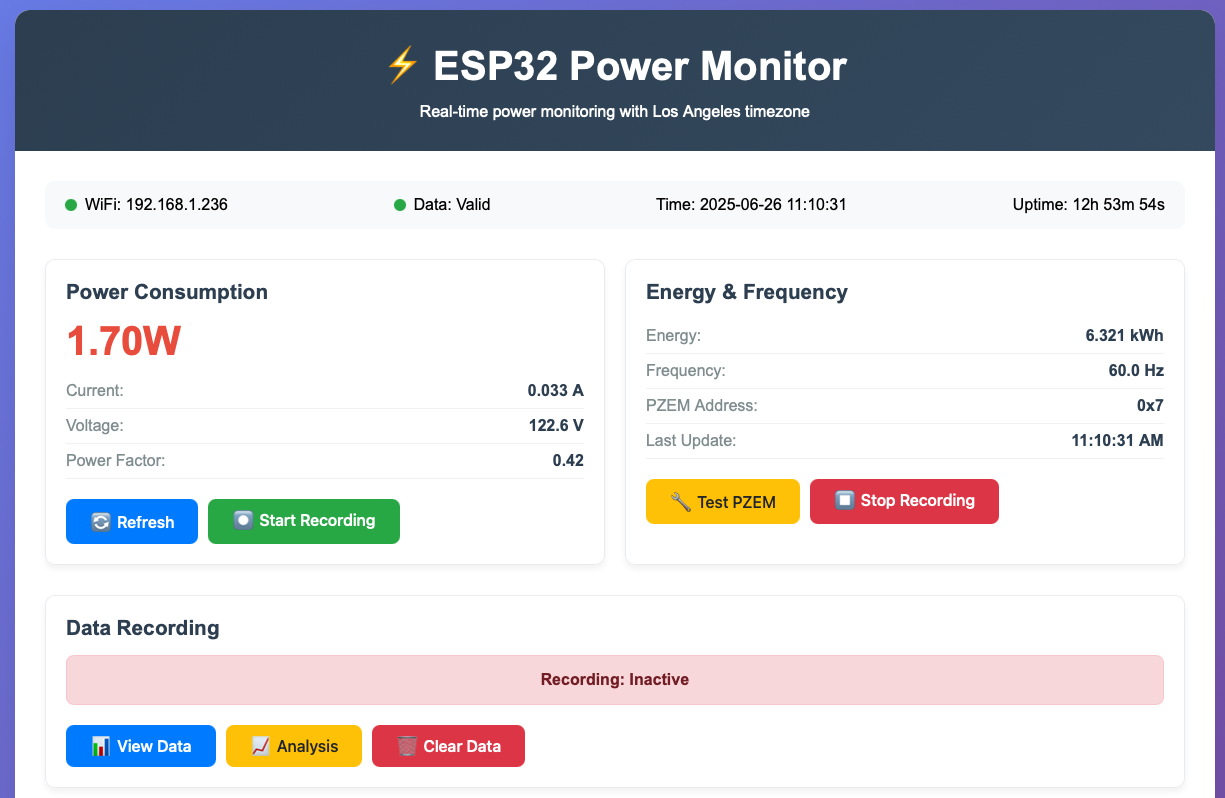
I will briefly go over a few key features:
- Pull-based data collection. You can send a
GETrequest to\/dataendpoint to get the current reading of all metrics. - Data recording and downloading. Use a
POSTrequest to\/record/startto set the interval and start recording metrics, and use\/record/stopto stop the recording. Finally, useGETat\/record/datato download the data in JSON format. - The data recording and downloading are integrated in the frontend. You can use the button to start and stop the recording, and download the data, straight from your browser.
Backend
InfluxDB + Telegraf
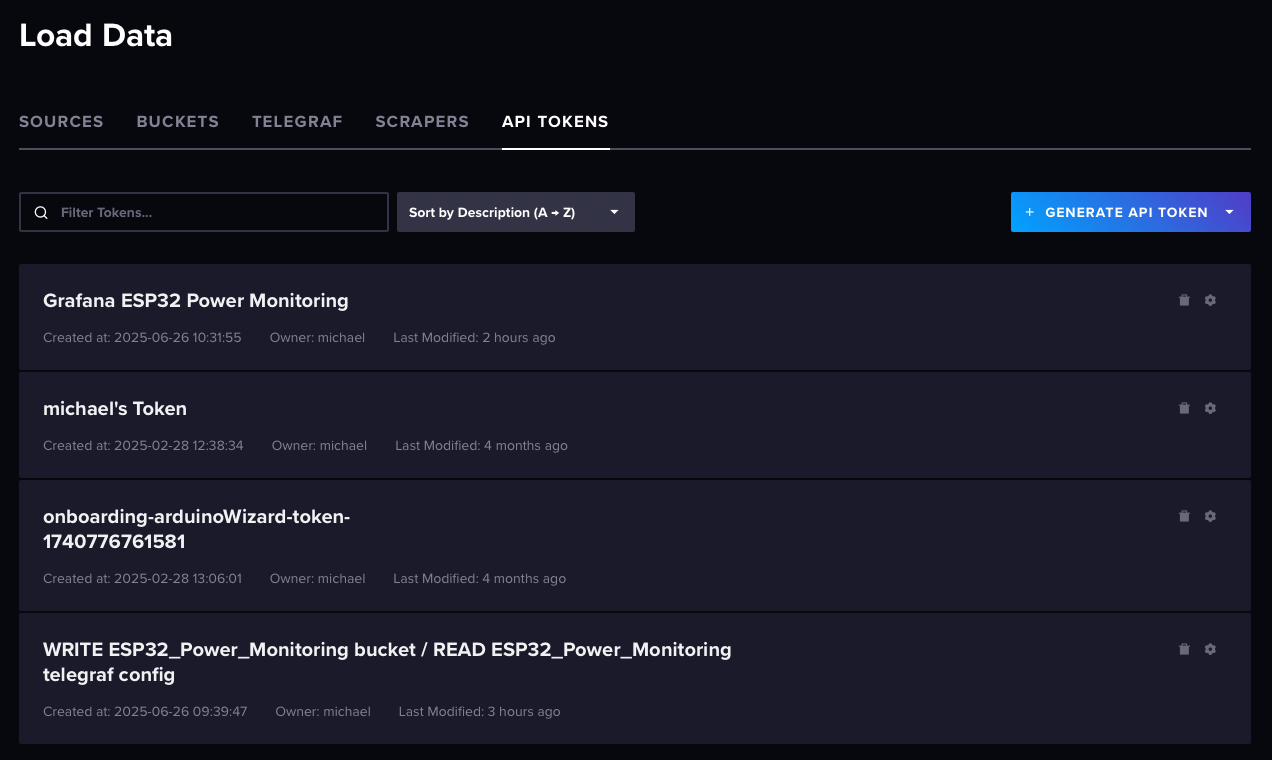
I won’t go into too much detail into how to set up InfluxDB as the documentation is plentiful. I used Proxmox Helper Scripts for InfluxDB to deploy an LXC, went through the setup process and it was up and running in no time. Then, I created a bucket named “ESP32_Power_Monitoring” and generated an API token. I prefer to set the API token as an environment variable, but you can also hardcode it into the Telegraf configuration file, which we will be getting to next.
We will use the Telegraf to poll the data, and subsequently insert it to the data bucket. Configuration for Telegraf can be found in the repo. You will have to change the necessary lines to match your setup.
- urls = "http://YOUR_INFLUXDB_IP:8086": Set to your InfluxDB server.
- token = "$INFLUX_TOKEN": Set the environment variable INFLUX_TOKEN or hardcode the token.
- organization = "YOUR_ORG": Use your InfluxDB organization name.
- bucket = "ESP32_Power_Monitoring": Match your bucket name.
Backup the default Telegraf config and create a new one:
mv /etc/telegraf/telegraf.conf /etc/telegraf/telegraf.conf.bak

nano /etc/telegraf/telegraf.conf
Paste the configuration from the repo, make edits, save, and start Telegraf:
# Configuration for telegraf agent
[agent]
  interval = "10s"
  round_interval = true
  metric_batch_size = 1000
  metric_buffer_limit = 10000
  collection_jitter = "0s"
  flush_interval = "10s"
  flush_jitter = "0s"
  precision = ""
  hostname = ""
  omit_hostname = false

[[outputs.influxdb_v2]]
  urls = ["http://YOUR_INFLUXDB_IP:8086"]

  ## Token for authentication. You have to generate the token from influxdb, and set the environment variable
  token = "$INFLUX_TOKEN"
  organization = "YOUR_ORG"
  bucket = "ESP32_Power_Monitoring"

[[inputs.http]]
  urls = ["YOUR_ESP32_IP"]
  method = "GET"
  timeout = "5s"
  data_format = "json"
  name_override = "power_consumption"
  tag_keys = ["address"]
  json_query = ""
After saving the configuration file, you can start the Telegraf service.
systemctl start telegraf
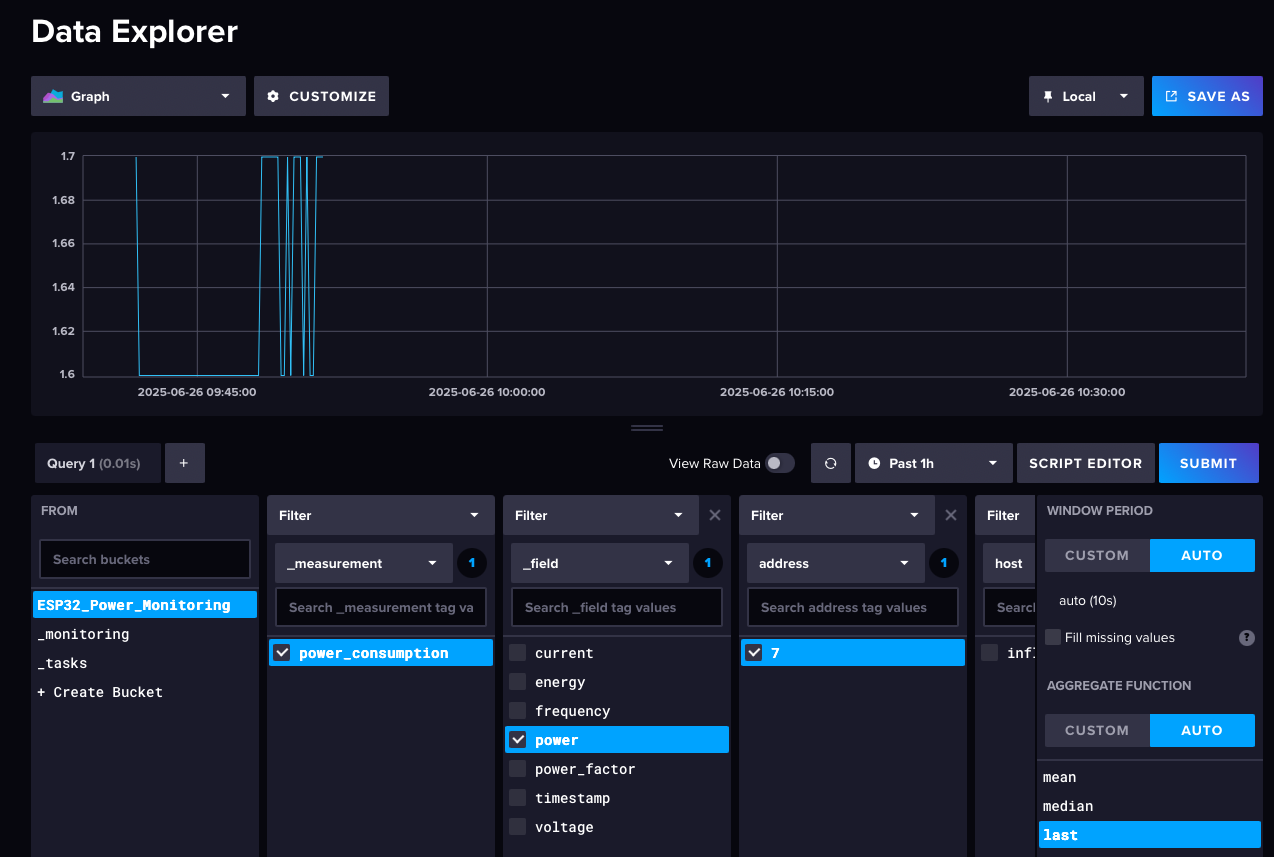
Go back to InfluxDB webpage, select your bucket, you should be able to see the data collection has been set up.
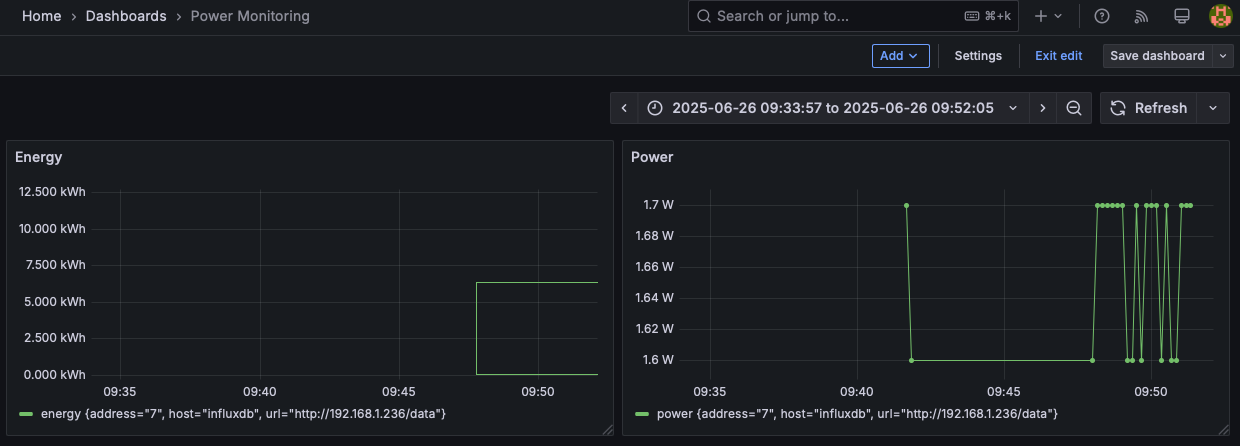
Grafana Visualization
I chose Grafana for visualization to learn its features, though InfluxDB’s built-in dashboard would work too. To set up Grafana, I used a script for LXC deployment:
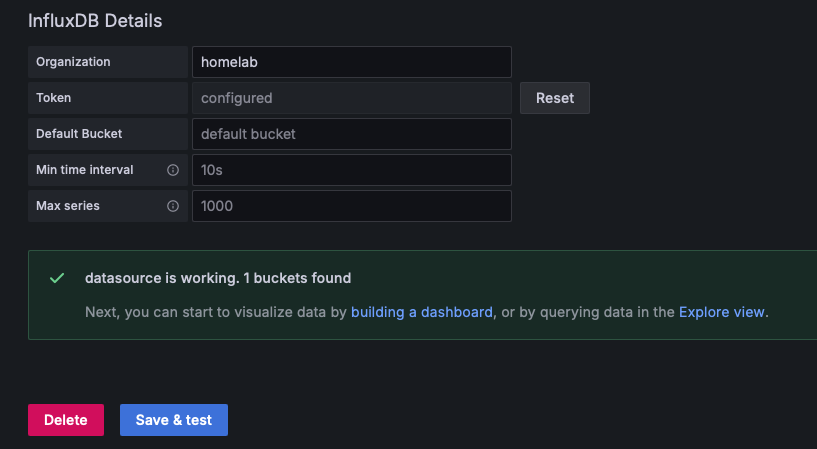
- Select Flux as the query language (for InfluxDB 2.x).
- Enter your InfluxDB server (your InfluxDB IP address), API token (read scope for ESP32_Power_Monitoring), and organization.
- Click Save & Test to verify the connection.
Go to Connections > Add new connection, search for InfluxDB, and click Add new data source.
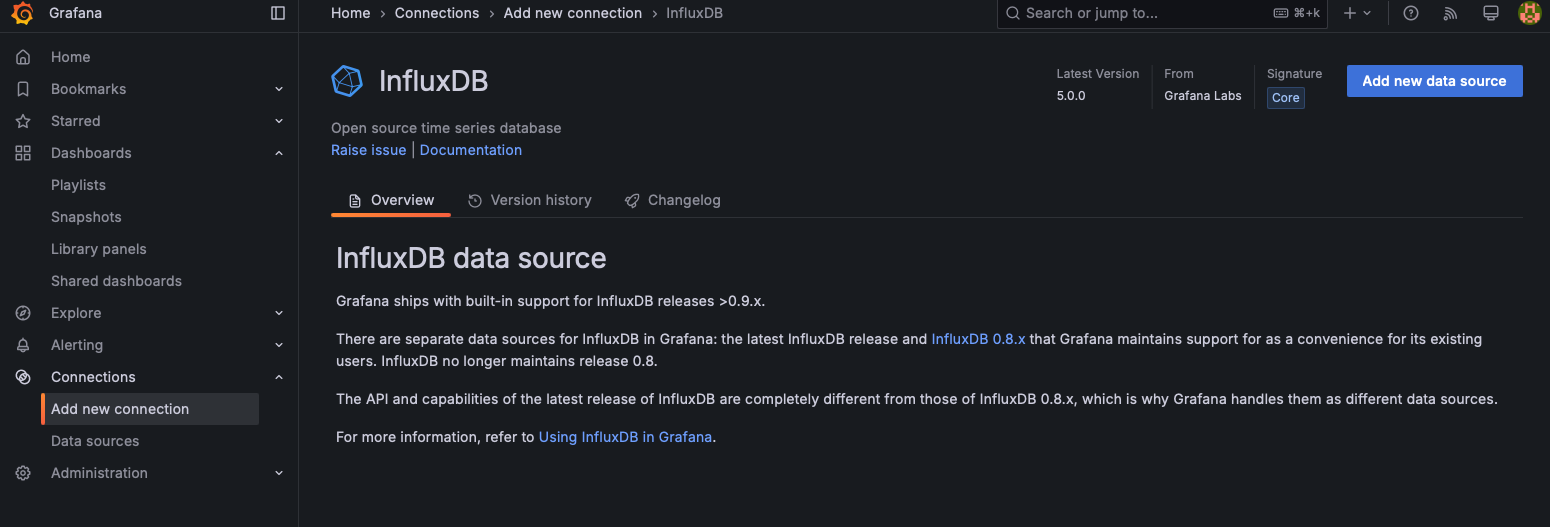
If everything works accordingly, you should see a success message.
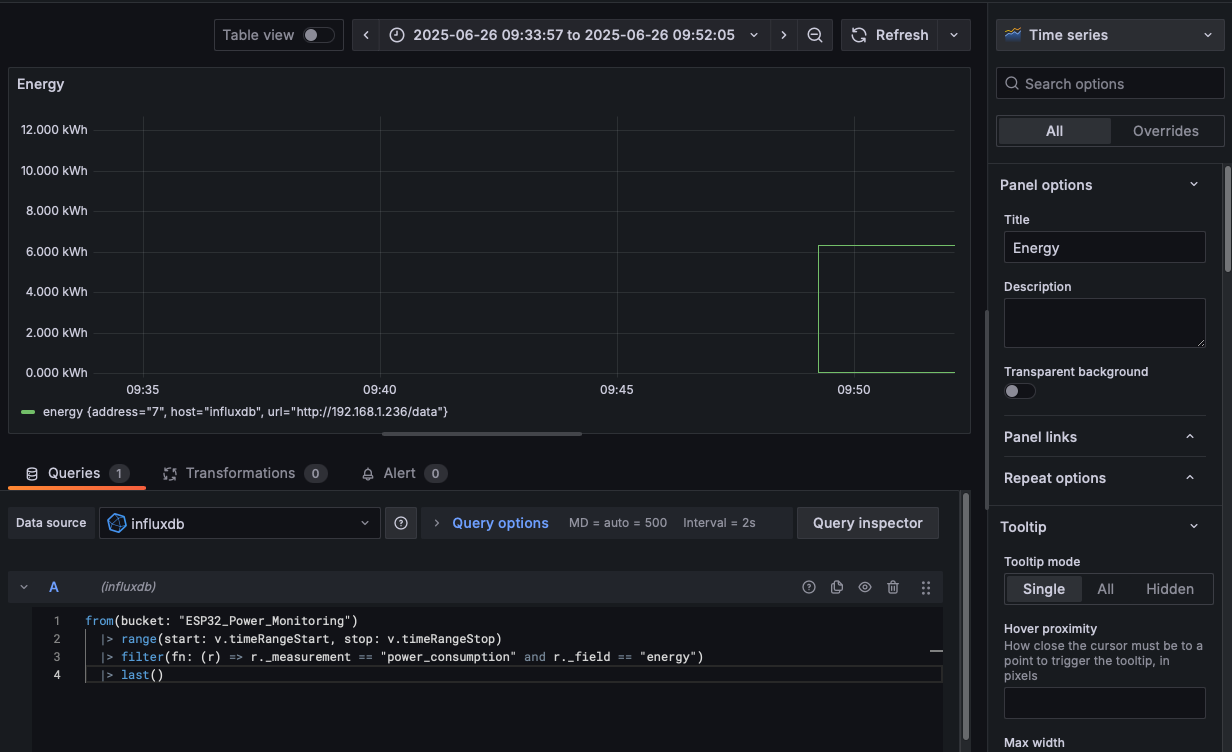
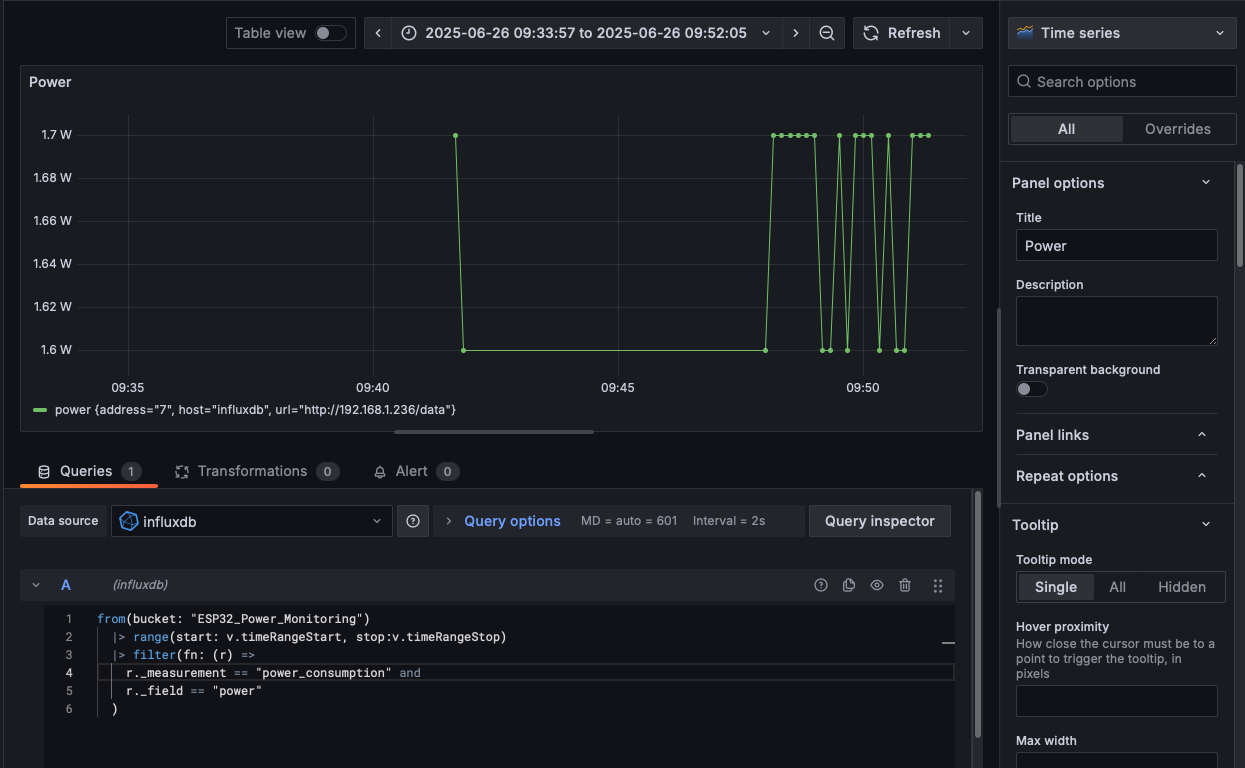
After that, we will set up the dashboard and the queries. I’ve included two queries in the Github repo for your reference. You can also customize the look and feel of the dashboard further.
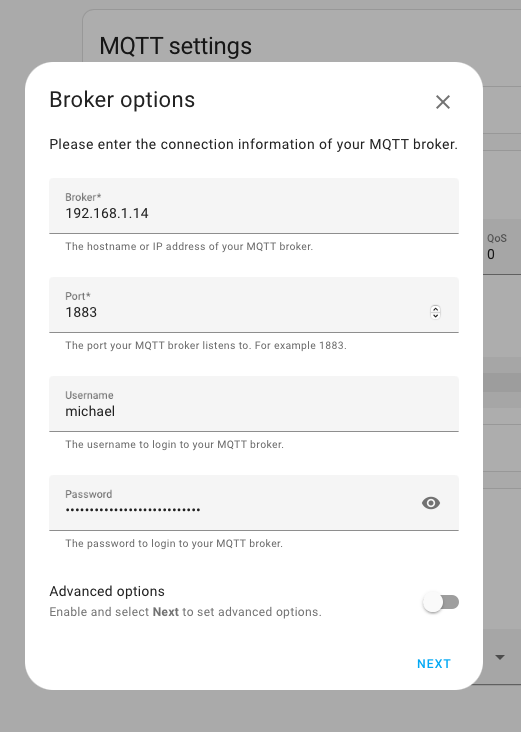
Home Assistant with MQTT
In the configuration file, you will have to supply the IP address of the MQTT server. I have installed the MQTT plugin in my HA server, so the IP address is just simply the IP address of it.
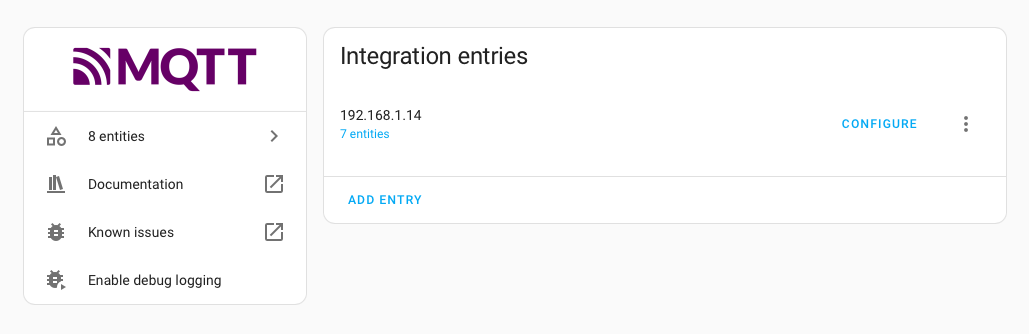
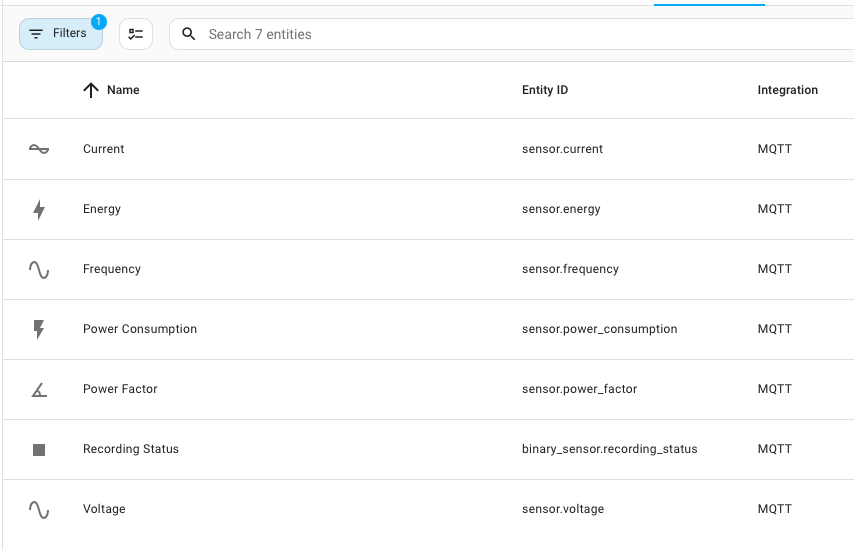
The "entities" should come right up if your configuration checks out.
Next Steps
If you’re as obsessed with power monitoring as I am, I hope this tutorial sparks some ideas! This setup isn’t perfect—it lacks authentication, so anyone with the ESP32’s IP can access the data. I’d also love to add a local display (like an OLED) for quick readouts without a browser. An enclosure would make it safer and more portable. Plus, I am really looking forward to explore MQTT for seamless Home Assistant integration.
Could this janky setup be commercialized? What features would you add? Share your thoughts in the comments.